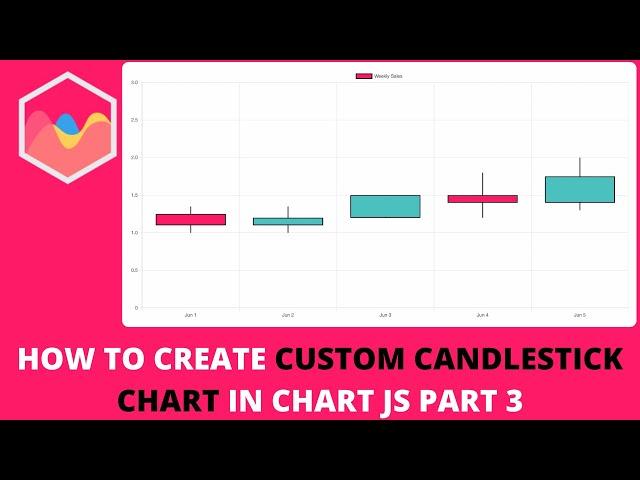
How to Create Custom Candlestick Chart In Chart JS Part 3
Комментарии:

Thank you video. But how to change rectangle to circle, i want the circle to be the average point. have searched many ways and many charts but I can't find the one I want. Please help me!
Ответить
Thank you very much for your videos, I follow this candlestick chart project, I wanted to ask you if you can make an example with the data taken from a database, thanks for your attention
Ответить
Can you help me i added zoom plugin and wicks when i pan do not clip like bar clips on X axis is there some z-index ?
Ответить
Could you please help with candles that have 0 change? How to display minimum 1px green line?
Ответить
I am from the java/python/database side of the house. I am working on an AI project to analyze stock dataset and need some help on the front-end side. I am glad to find your channel and I must say that your knowledge on chart.js/javascript is among the best. Thanks for all the good videos.
Ответить


