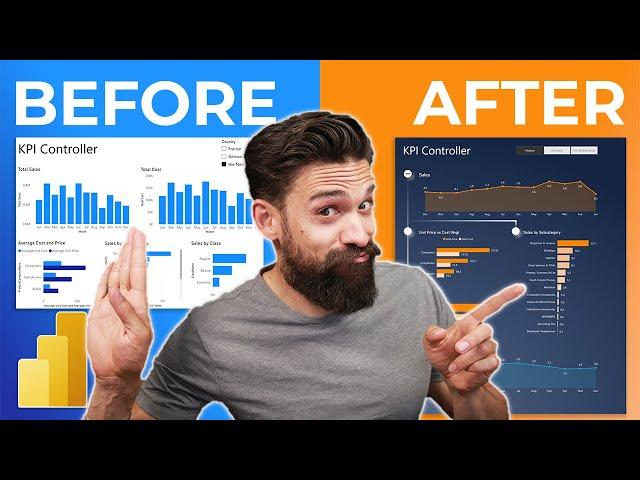
Upgrade Your REPORT DESIGN in Power BI | Complete Walkthrough From A to Z
Комментарии:

You really have a good vision man,soo good pbi visualization
Ответить
Wow! A visual masterpiece a usual. I am able to follow step-by-step with your designs. You are truly next level. I definitely would love to more videos about overall design elements. I have been developing dashboards for a few years and now I can incorporate my graphical designer background. If you are able to do a video series on typography, that would be amazing. That's another simple yet extremely impact design feature that's off overlooked. I prefer to put significant development on the simple design features and expand out which is what you are gifted at accomplishing!!
Ответить
for example you wana show in percent and also charts to show you in percent how will you do that example : 30% to be shown in chat ?
Ответить
Amazing !!
Ответить
This is awesome!
Ответить
Bloody hell, just wasted 30 minutes of my time, because for me the trick with measure for transparency did not work! After 30 minutes I noticed that I made a typo - instead of rgba(... I inserted rbga(.... Stupid mistake :D now it works. Thanks for your tips and videos, I could not imagine that this is possible with Power BI and PowerPoint.. thanks again.
Ответить
PLease do share the dataset link also, so we can try with you as well while going through the videos.
The videos are completely understandable,
thank you.

This is fabulous. Thank you so much.
Ответить
Where is practice file????Just watch you but don't practice yet.
Ответить
awesome beard 🧔♂
Ответить
allah senden razı olsun reis
Ответить
The overlay is good and the graphic formatting changes you made are great. However, I would never sacrifice ease of readability for the sake of looking "modern" or "interesting". Your final result has a dark background with a blue gradient (!)and total cost data is in teal? That's not a good combination. Neutral grey is much easier on the eyes for a background --and if a more colorful presentation is desired I make sure the contrast is aesthetically pleasing. Of course, all else has to be in place as well so that is not just eye candy.
Ответить
Gorgeous dashboard!! te veo desde Argentina 💙
Ответить
Is it possible to download the .pbix file?
Ответить
amz job man, really impressive
Ответить
How do I make my imported svg file show on a phone mobile view on power bi? It has a different layout on my phone power bi
Ответить
For sure the best vedio for learning how to perfectly design dashboard
Ответить
So many tips picked up from this video, Thanks Bas.
Ответить
Cool video. Couldn't tear myself away from watching. I'm a beginner in Power BI, but watching is inspiring me to keep going.
Ответить
Wow what is this how can you make this 😭😭, I want to see now all your videos
Ответить
You're an Artist Man! You made great. I am very happy for learnt that. :)
Ответить
Thanks for this amazing video. Quick question : what is the best canvas size according to you ? I need to deploy powerbi dashboards to many employees that are not used to it (and not used to follow kpi either). So would you recommand to stick to a 16:9 to avoid any click ? Or according to you is it ok if they have to scroll a bit ? Thks
Ответить
Don't u leave link to the resource you're using so we can download and power Bi with you?
Ответить
Wow... Simple wow 😮
Ответить
You have done it in a crazy nice way, true creative guy! thanks.
Ответить
Wow excellent presentation. Thank you !
Ответить
You deserved million of subcribers.
Ответить
Best Power BI content I've found thus far. I hope you continue to make these types of tutorials.
Ответить
Amazing Video. Please do a power Bi course for beginners. Thank you
Ответить
This video alone single handedly took my Power BI reports to a whole new level!!! Thank you 🙏🙏🙏🙏
Ответить
Amazing
Ответить
This is amazing, thank you so much Bas! :)
Ответить
Thanx Bas! Great insights, tips and tricks. Hope I can use to boost my salary later! 😂
Ответить
This report design is stunning. Many thanks for sharing with the community. You're the best!!🤝
Ответить
Finally someone that makes Power Bi videos fun and interesting, huge props to your sir (and the team behind if there is one) the mad lads
Ответить
I just want to tell you that I love your accent, it makes you cutter
Ответить
how to get rid of the tree line (button) mouse hover menu, so it's just a visual and not interactive?
Ответить
Great video man, that was great. Appreciate it
Ответить
Thank you Bro there were some knowledge that you listed here that worth alot
Ответить
muy bueno
Ответить
wow i love it , thank you dear for sharing your experience with us.
Ответить
Master on Power BI
Ответить
hey bas one of the best detailed videos I have ever watched how you make use of so many features are really great. but I have an issue opening the SVG file it shows up as a html and I can't use it power bi do you know anyway I can fix that issue.
Ответить
Nicely explained the features and steps.
Ответить
Splendid! In fact, it even gave another review, it really got much more visual and beautiful!
Thank you for sharing this great knowledge!!
Hugs from Brazil, direct from São Paulo.

Dank je wel gozer!
Ответить
I love you
Ответить
I download the Training data but the report is complete where can i found the basic one u start with ?
Ответить


