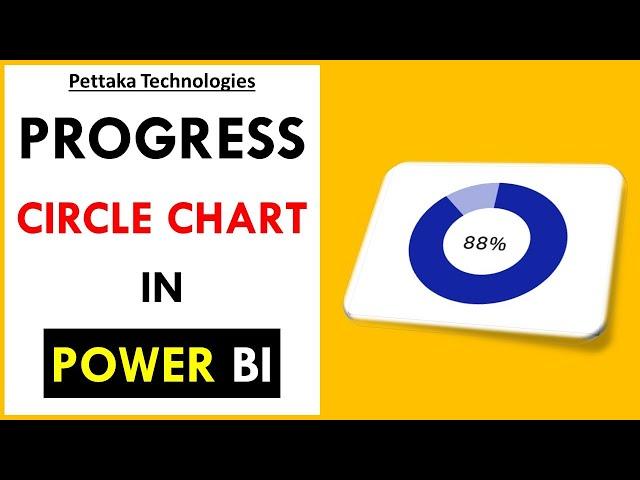
How to make Progress Circle Chart in Power BI
Комментарии:

Agnaldo Fondo - 04.03.2023 22:13
This method doesn't work in Power BI Desktop as of March 2023. Values shows in decimal, not percentage.
Ответить
Arch.Mohanad Saud - 30.12.2022 14:16
What if i want to calculate the cumulative percentage when I choice May for example?
Ответить
sconnell194 - 05.07.2021 03:44
👍
Ответить
Smiley Movie Review - 04.06.2021 15:44
Superb. Very much informative.
Ответить
PowerPoint Tutorial - 04.06.2021 15:18
Creative and Useful video. Rocking
Ответить
Tutorial Stop - 04.06.2021 14:58
Can you make some videos on calculations in Power BI. Eg (Productivity, Overtime, Allowance, etc)
Ответить
Vani Kannan - 04.06.2021 14:38
Informative and Useful video. Thanks for sharing Pettaka Technologies.
Ответить
How to make Progress Circle Chart in Power BI
Pettaka Technologies
Актеры озвучивания играют в Detroit: Become Human - часть 1
Voice-Act-Play-Repeat
Juice WRLD - Wasted/Snippet
Trill Snippets


