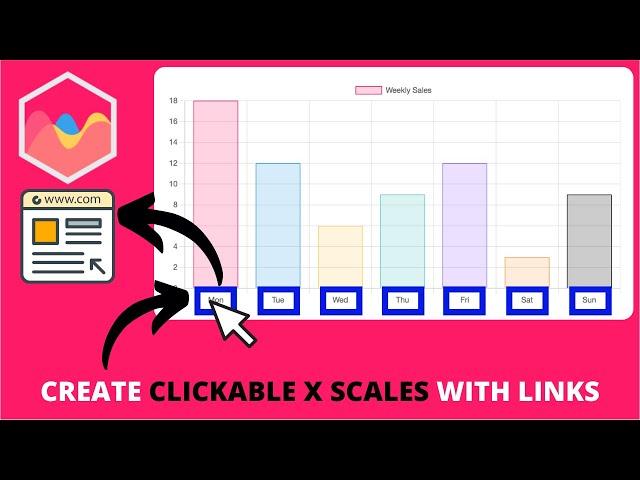
How to Create Clickable X Scales with Links in Chart JS
Комментарии:

looks like trash, i think this feature must be inside library
Ответить
Uncaught TypeError: canvas.getBoundingClientRect is not a function, this is my problem js, help me please ?
Ответить
Very helpful and works great! One thing to note, if you use a Zoom feature this will cause issue because the change in the axis results in the link being incorrectly targeted. For example if you have 8 axis labels along with 8 links, if you zoom into to lets say 4 of them and then click, it will choose 1 of the first 4 links you had in your array, which will be wrong if you zoomed into 4-8. Luckily the position index of each axis label is stored in the object so you can reference the specific link you want by doing the following:
for(let i = 0; i < chart.scales.x.ticks.length; i++){
if(x >= left + (right * i) && x <= (left + right) + (right * i) && y >= top && y <= bottom) {
//the following will grab the specific labelsLink based on the current ticks stored value which is the original.
window.open(chart.config.data.labelsLink[chart.scales.x.ticks[i].value]);
}
}

options: {
onClick: (event, elements) => {
if (elements.length) {
const label = myChart.data.labels[elements[0].index];
// Do something with the clicked label
console.log('Clicked label:', label);
}
},

I don't see the max-width in my console, just width, height, etc
Ответить
Hi. How can I make my bar graph clickable in java? As I want to make function in class file in java and give its path in html.
Ответить
Hi, I tried but it doesn't work, in my opinion there is a wrong data.
if(x >= left + (right * i) && x <= right + (right * i) && y >= top && y <= bottom)
when you set x less than or equal to the width you should also add the block on the left.
if(x >= left + (right * i) && x <= DIFF + (right * i) && y >= top && y <= bottom)
WHERE
const DIFF = right + left
Otherwise, when clicking, the pixels of the initial block are always missing.
In the meantime, I'm sorry if I got in the way, but could you take a look?
Thanks!
bye

Can we use this function for multiple charts on same page without repeating these lines of code?
Ответить
Could you do the same for the label for y-axis? what is the formula? Thank you very much
Ответить
Thank u for the tutorial
Ответить


