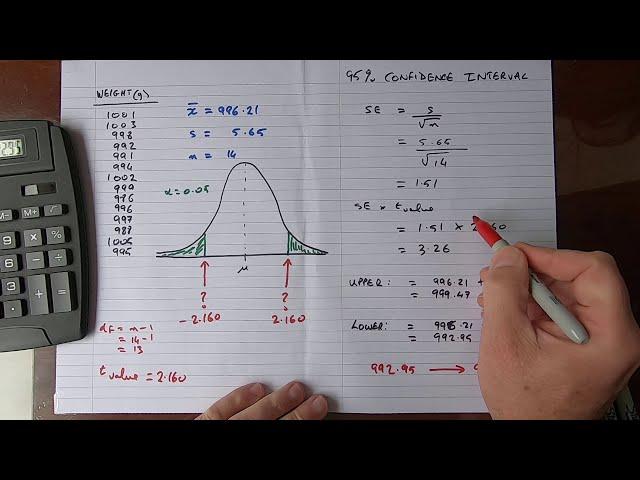
How To...Calculate the Confidence Interval for a Sample
Комментарии:

your videos are always so straight to the point and helpful, thanks for everything you do.
Ответить
you explained it very clearly sir, thankyou!
Ответить
good, so now i know how to calculate it, BUT why is it called confidence interval? it is just taking properties of my limited sample and multiplying it with bell curve properties to simulate that my data somehow magically is enough data so that i can reliably tell me by adding normal distribution properties mechanics, that it can tell me the chance that the populatin mean lies between these 2 values. sounds pretty daring. i have no clue yet ehy this works or should be true, and under which circumstances.
Ответить
this video REALLY helped thx
Ответить
Great video and came in right on time! Let me see if I can get the right answers now.
Ответить
Amazingly explained - Thank you!
Ответить
great video sir
Ответить
phenomenal
Ответить
Thanks for help! This video helped me so much more than my professor!! Keep up the great work Sir 😀
Ответить
Easy to understand... at last. However, there are 4 results in the list of weights that are outside the CI range. 4/14= 28%. I thought that in a 95% CI range there would only be a 5% chance of having a result outside of the range
Ответить
this is the best work❤
Ответить
Nice, and what if my T table only has one-tail?
Ответить
thank you. how do we know when to use the t table vs z score?
Ответить
I have been searching on how to solve this problem and you WERE able to break it down and i was able to follow without any problems. Thank you
Ответить
Very helpful, thank you so much.
Ответить
very good job sir
Ответить
so, any sample values above 999.47 and below 992.95 are rejects????
Ответить
Thank you that was very clear. I am trying to understand what it means when someone says something like "that is one standard deviation out" when talking about outliers in a population. I heard it in relation to the distribution of IQ results and the challenges faced by people with an IQ at a certain (low) level?
Ответить
Thank you so much😭 I’m doing my assignment right now and couldn’t understand the teacher that was supposed to teach me this. Thank you for such clarity in how it’s done.
Ответить
if the sample size is more than 30 should we refer Z table rather than T table?
Ответить
I'll try this today
Ответить
very useful, explained very well, thank you!!!!!
Ответить
Thank you very much! Was very helpful.
Ответить
Very useful sir❤
Ответить
4mks sure bet
Ответить
OK it is in, Teacher Extraordinaire. Thank you for this.
Ответить
Yar Mera paper hi ton Dy aa state da
Ответить
Thank you. You manual calculation videos are really show the essence of statistics. I always use Minitab to analysis data, actually don't understand how to get the results. Your video helps a lot.
Ответить
why is it when im doing the math at 95% CI it does'nt match with my excel curve Area result.. it yields around 75% only when im estimating the sigma values to plot the normal dis curve.
Ответить
That was very clear. Thank you.
Ответить
This was very much helpful, thank you.❤️
Ответить
Thanks
Ответить
Awesome
Ответить
Thank you Sir!
Ответить
You are the best professor
Ответить
Thanks man
Ответить
Thank you so much
Ответить
Genius! Thank you so much
Ответить
you da goat
Ответить
you're solid my guy
Ответить
Help me please how to calculate the n=14 in his video? Thank you
Ответить
ty
Ответить
Hello! What if the df value is 94? How will you find the T-value?
Ответить
sir, you are a godsend. thank you so much for the informative but brief video!
Ответить
Why do we indicate the t values on the curve? Shouldn't we be indicating the upper and lower limits (i.e. in this case 992.95 and 999.47) there instead?
Ответить


![[REVIEW] 12 Vị SIÊU LẠ Chocolate Tươi NAMA Royce': Whisky, Cherry Tuyết, Remy Martin, Matcha Phô Mai [REVIEW] 12 Vị SIÊU LẠ Chocolate Tươi NAMA Royce': Whisky, Cherry Tuyết, Remy Martin, Matcha Phô Mai](https://invideo.cc/img/upload/UUJEVlJSNkZWRzc.jpg)


