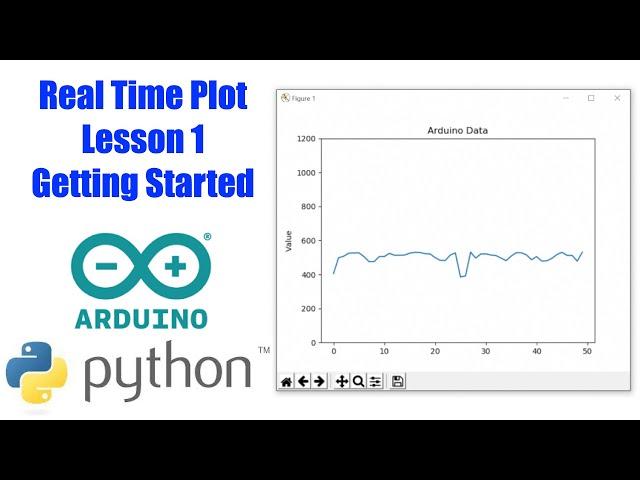
Arduino and Python Real Time Plot Animation | Lesson 1 Getting Started | PySerial MatPlotLib
Комментарии:

It's been a dream of mine to pump Arduino data into Libreoffice Calc so their pre-existing charting facilities can easily be used, data logged and processing can be done all in one place. Matplot lib is IMHO the last step before doing it in calc. Love your python/arduino vids - thank you.
Ответить
Thanks you for this video
Ответить
Excellent video!
Ответить
It helps me a lot!! Thank you for sharing.
Ответить
can i use this with tkinter instead??
Ответить
thank you sir, all your tutorial has been amazing for me and it's very useful at my work. I can't wait more video from you .
Ответить
Hi Sir, thanks for this video that helps me a lot. Nevertheless, for your x axis, how could it be possible to have this plot "in real time" with your time as your x axis. Here, your x axis is fixed. Thanks for your answer !
Ответить
I am using Jupyter Notebook
When i input the letter 'g' my plot is empty, showing nothing😢

you're a freakin life saver, i was searching for a week how to not have a plot with increasing number of points, that -50 saved me.
Arigato Gozaimasu.

Hi, Great video. How can I plot three different values being sent by the arduino? Please help
Ответить
are dri no Oo No
Ответить
you're the man
Ответить
Can we plot the data from raspberry Pi pico
Ответить
serial data from ports send to python environment.
and python matplotlib plotting real time data.
here you are using 2 software
arduino IDE
and
Python
is this possible so i could use just 1 using ardunio uno?

Excellent thank you
Ответить
Thank you for your help. This tutorial was extremely helpful for my signal processing assignment :>
Ответить


