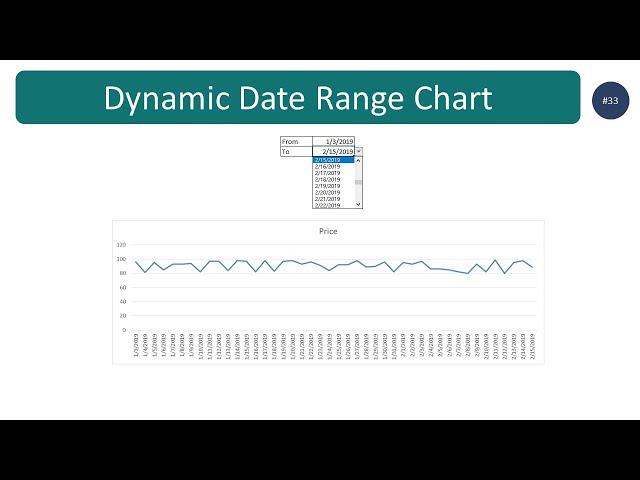
How to create Dynamic Date Range Line Chart in Excel (step by step guide)
Комментарии:

Goated Video
Ответить
HI, my dates and values are in a row not a column, when I do the array for the IndexMatch, I am getting a spill from start date to end date. Could someone please advise on how to stop this? Thanks
Ответить
Great video - just what I was looking for! Can this be done for multiple column prices? I
Ответить
Many thanks! I didnt realize you could pull a range of data with the : between the two index forumlas!
Ответить
WEEKLY DATA?
Ответить
I have a question, I did finished it. But after using the drop down list after 3 or 4 times, the chart stops following the range dates. I need to re input the F3 in the data
Ответить
I have done a similar graph. I want the date to be shorter, without the year on the graph. It's possible?!
Ответить
Nice video. Can you advise how I'd do this for half hourly data rather than daily data? I'm struggling to make it work
Ответить
let me suggest formula for more column category for single date column.
Ответить
could you please write the formula here on the comment section, i can't read it
Ответить
Nice chart
Ответить


