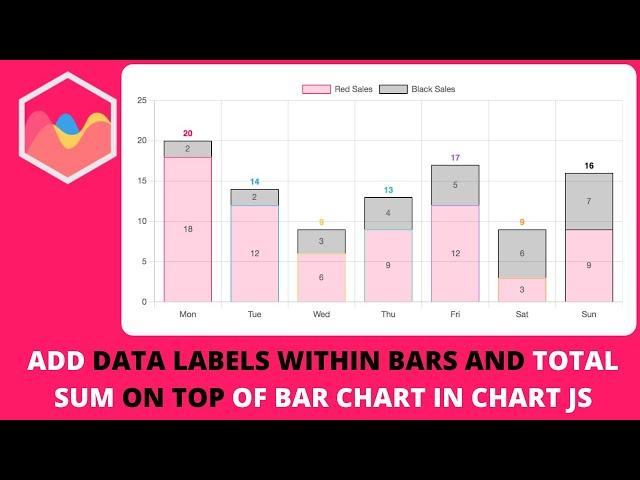
How to Add Data Labels within Bars and Total Sum On Top of Bar Chart in Chart JS
In this video we will explore how to add data labels within bars and total sum on top of bar chart in chart js. With the data labels plugin we can add values within the bar or on top of the bar. However, the moment we want to add it on both locations it is not possible.
This means we will need to have the chartjs-plugin-datalabels and a custom plugin to create the total sum on top of the bar chart. The custom plugin must be able to calculate the sum of the stacked bars and make sure it moves along nicely. We will be using some advanced options and tricks to get this working.
Let's explore how to do this.
▬ Chartjs Viewers Question Series ▬▬▬▬▬▬▬▬▬▬
This is part of the Chartjs Viewers Question series. Where we answer viewer questions. This question was asked by one of our viewers.
▬ Materials/References ▬▬▬▬▬▬▬▬▬▬
To keep the video short we might expect you to know parts. These parts we have explained in other videos. You can find the references here below:
Understand setup, config and render init blocks: https://youtu.be/pFuibt5HNog
Starting Code: https://www.chartjs3.com/docs/chart/getting-started/
▬ Got a Question? Comment! ▬▬▬▬▬▬▬▬▬▬
Got a question or special request about a specific item? Comment below and tell me your question. I will make sure to follow up on you!
▬ Find Me Here ▬▬▬▬▬▬▬▬▬▬
Blog: https://www.chartjs3.com/chart-js-blog/
Website: https://www.chartjs3.com
Udemy Course: https://www.udemy.com/course/chart-js/?referralCode=56B57F673E9D41FF4AD2
Chart JS tutorials for Beginners:
🎓 Beginners Serie: https://www.youtube.com/watch?v=W6ai7wu5VIk
Chart JS tutorials for Intermediate:
👁️ Most Watched Chart JS Video: https://www.youtube.com/watch?v=4jfcxxTT8H0
⭐ Personal Favorite Chart JS Video: https://www.youtube.com/watch?v=PuFYW1yHzl4
Chart JS Dashboard Series:
👍 Most Liked Video Series:
Watch Part 1: https://youtu.be/l3MnVpiHXBU
Watch Part 2: https://youtu.be/fDUo-LbrRSo
Watch Part 3: https://youtu.be/xlt5dDa8rz4
▬ About Us ▬▬▬▬▬▬▬▬▬▬▬▬
Why we created these #chartjs and #javascript video tutorials?
WHY
Creating charts in javascript is very rewarding but extremely challenging. The Chart JS library made it easier to render charts. However the chart js documentation is hard to understand for many. It requires a lot of different moving parts to work along. The canvas tag, javascript, arrays and Chart JS all need to be combined to draw an eye catching bar chart or line chart.
The videos explains the chart js documentation in a more visual and easy to understand way. You can follow along with the code and quickly grasp how it works. We cover the code in chart js but also what truly happens and why something happens when we write a line of code. This fundamental understanding gives clarity to you as a developer in chartjs. In short it is the Chart JS video documentation.
HOW
We answer questions from YOU (viewers) by creating an answer video that covers the questions YOU have posted in the comment section.
WHAT
Our goal is to help YOU learn how to draw charts in Chart JS by showing you in video format how to do it.
Chart JS Video Documentation Site: https://www.chartjs3.com
▬ Chart JS 3.7.1 ▬▬▬▬▬▬▬▬▬▬▬▬
Chart JS is a javascript library to draw charts in the canvas tag on your site. Presenting data in a visual manner such as charts is more effective and appealing. All the charts are always coded in the latest Chartjs version which is as of this recording Chart JS 3.7.1.
What type of charts can you make with Chart.JS?
With chart js you can make line chart, bar chart, pie chart, doughnut chart, scatter chart, polar area chart, radar chart, gauge chart and area chart. And with some clever tricks and visual adjustment more can be done.
Тэги:
#how_to_add_data_labels_within_bars_and_total_sum_on_top_of_bar_chart_in_chart_js #add_data_labels_within_bars_and_total_sum_on_top_of_bar_chart_in_chart_js #chartjs-plugin-datalabels #datalabels_plugin_in_chart_js #mysql_database_in_chart_js #chart.js #chart_js #chart_js_tutorial #chartjs_3 #chart_js_3 #chart.js_3 #chartjs_3.7.1 #chart_js_3.7.1 #chart.js_3.7.1Комментарии:

Hello! Will the code be different if live the red and black bars side by side on the X axis? And is it possible to do without chartDataLabels?
Ответить
Hello and thank you for the video! Is it possible to make click event and get x-axis label value?
Ответить
Hello and thank you for the video! Is it possible to rotate the total sum labels?
Ответить
Hi! How do we do the same using chart.js version 4.4?
Ответить
is it possible to hide red sales / black sales number, leaving the total sum only?
Ответить
Great video, but as usual, because I'm using a datastructure created from a CSV file, this code does not work for me. I receive an error: "Cannot read properties of undefined(reading 'y')". Any idea on how to fix this?
Ответить
and how to put total on right of avery bar for horizontal chart?
Ответить
Great example, thank you very much.
Ответить
Thanks for the great video, is it possible to change the total value by switching Legend?
Ответить
Excellent video!
Ответить
Can I use it with vuejs please
Ответить
Excellent video tutorial, I would like to know if it is possible to put the percentage in the lebels. For example, total 100 on top of the bar and in the middle the percentage, Dataset 1 25%, Dataset 2 25%, Dataset 3 25%, Dataset 4 25%.
Ответить
Hi Thanks for video and showing us how to do. I have a question here as you did the grace part in the video which extends the y-axes to 25 what if the stacked bar chart is showing percentage and we can use it up to 100 so adding more to the y-axes doesn't seems good. can we do the internal padding like thing using layout or something such that it adds space between the chart total at top & legend ?
Ответить
Should this method work with react-chartjs-2 as well? Currently I’m getting an error saying “Cannot read properties of undefined (reading ‘data’)”
Ответить


