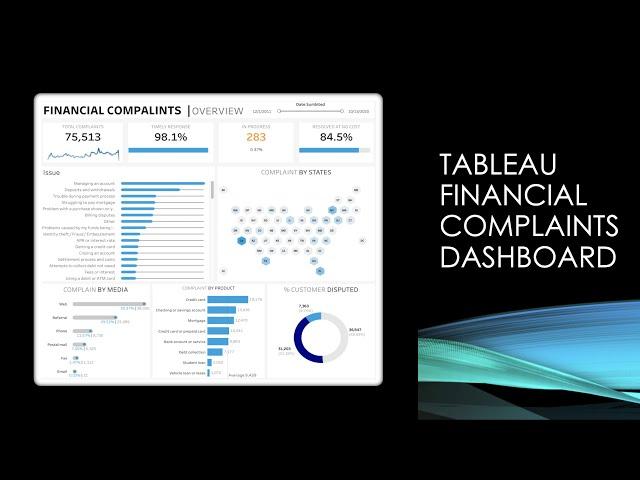
Tableau Financial Complaints KPI Dashboard | Learn Tableau By Developing Dashboard
Want to learn advance tableau visualizations? Enroll in my training program. Contact me @ [email protected]
Other Tableau Projects and Dashboards - https://www.youtube.com/playlist?list=PLH6mU1kedUy8sfWpm1zzpRejgr4NDSyff
Data Set Link - https://data.world/markbradbourne/rwfd-real-world-fake-data
Tableau Public Dashboard Link - https://public.tableau.com/app/profile/gandes.goldestan/viz/FinancialComplaintsDashboardRWFD/Dashboard
Тэги:
#Tableau_Dashboard_example #Tableau_Dashboard_design #tableau_financial_complaint_dashboard #financial_complaint_dashboard_tableau #Tableau_Dashboard_tutorial_step_by_step #Tableau_Dashboard_development #Tableau_Dashboard_template #tableau_Dashboard_design_ideas #learn_tableau_by_developing_dashboard #inspiration_for_tableau_dashboard #tableau_business_dashboards #tableau_creative_dashboard_idea #tableau_KPI_dashboardКомментарии:

why you use 1- for non timely response and non monetary?
Ответить
I can't find Dataset
Ответить
Thank you. I learnt a lot in this session. It was clear and very detailed.
Ответить
In Resolved at No Cost i get 100 % why that happens
Ответить
Thank you for this awesome tutorial.
Ответить
Thnx for sharing us the information and helping to understand in depth topics of tableau, really appreciate your work !!!
Ответить
Sir how can we add side icons to move from one chart to another in dashboard as shown in reference dashboard
Ответить
Awesome video thank you alot
Ответить
Amazing dude, thank you
Ответить
i want to learn advance tableau visualizations. I have sent you a mail but no feed back,will love to hear and read your reply
Ответить
Fun fact, Im only learning tNice tutorials because tNice tutorials is 99.9% of my ti in my free ti
Ответить
Very good tutorial, thank you :)
Ответить
Great video...ls keep it coming!
Ответить
Thank You, it helped me in learning many things. I appreciated
Ответить
Hi, please how can I get the data set you used so I can be able to learn along, because its not coming up for download
Ответить
Really Very Helpful. Thanks a lot Sir!!
Ответить
THANK YOU SO MUCH SIR, FOR SUCH A AMAZING CONTENT FOR PRACTICE.
Ответить
Sorry boring this guy. I didn't like his tutorial at all.
Ответить
sir teach us how to decode, if you wish to
Ответить
is it just me or there's a glitch in the video ?
Ответить
I really liked your projects . Appreciate if you can put more projects from Tableau Public. Thanks
Ответить
Very helpful . thank you for taking the time to teach us. 2 questions if you don't mind. The date filter is not affecting the Total Complaints KPI at the top, I imagine because we have that value fixed, but I think it should. Also for the tool tip on the Complaints by Issue chart, how do i get the bar to show under the label like it does on the original? By default the bar shows to the right of the label. Not sure how to change it.
Ответить
Sir apne jo 98% kare he lekin me public use koata hu plz mare nahi ho rahe he plz help me
Ответить
Gandes would be thinking it took me a week to make this dashboard and this guy made it look so simple. Amazing sir :)
Ответить
Please create this dashboard using power bi as well.
Ответить
Thank you so much sir for such a clear and detail explanation
this has greatly helped me in leveraging my tableau skills


